| Basic Information | |
| What is this? | The Coma Cluster, which contains thousands of galaxies |
| Where is it in the sky? | In the constellation of Coma Berenices |
| How big is it? | The cluster is millions of light years across |
| How far away is it? | Around 300 million light years away |
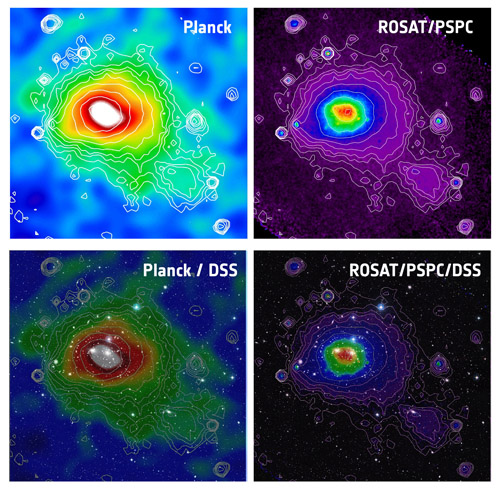
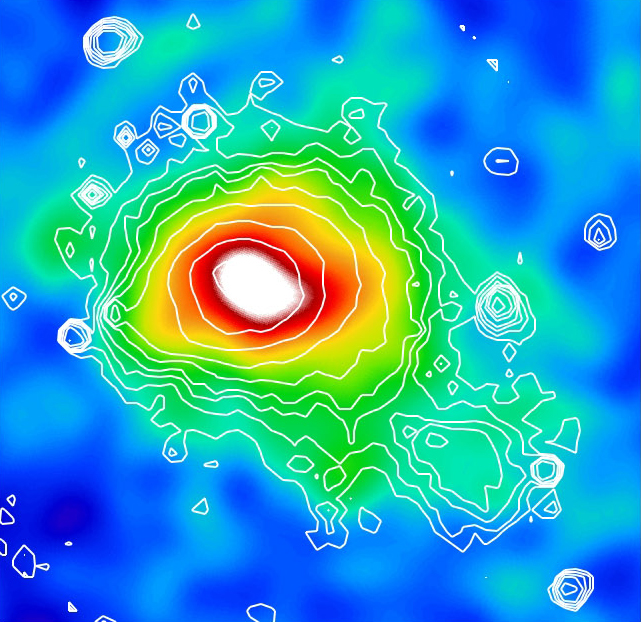
| What do the colours represent? | Red and white show the regions with the densest, hottest gas |
Downloads
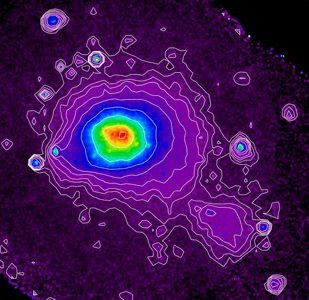
This colours in this image show the detection by Planck of the Coma Cluster, one of the most densely populated clusters of galaxies known. The extremely hot gas in the centre of the galaxy cluster has an effect on the light which originated in the Cosmic Microwave Background (CMB). The effect, called the “Sunyaev-Zel’dovich” effect is heavily dependent on frequency, and is apparent in data from Planck’s due to the wide range of frequencies it observes. The hot gas in the cluster is also emitting x-rays, and the contours on the image show the X-rays measured by the ROSAT satellite. The agreement between the two is a very strong indication that the two satellites are seeing the same thing.
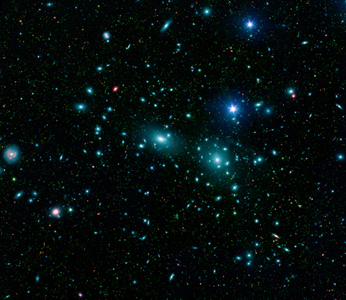
Above, you can see the Coma Cluster in visible and X-ray wavelengths. The Coma Cluster lies around 300 million light years away and contains thousands of galaxies of all shapes and sizes. The centre of the cluster is marked by a cloud of gas, which is heated up to extremely high temperatures. This gas is invisible at visible wavlengths, but emits X-rays. The gas is ionised, and the electrons are extremely energetic. They are so energetic, in fact, that when light from the CMB passes through, the electrons give it a little extra energy. The unaffected CMB radiation has a particular dependence with frequency, dictated by the CMB temperature of 2.7 K. The addition energy from the electrons in the cluster means that the the frequency-dependence of the light changes. Less light is seen at lower frequencies, and more at higher frequencies. Below, you can see four different combinations of the images above.

The Coma cluster as seen by Planck (top left) through the SZ effect and ROSAT (top right) in x-rays. The bottom panels show the same images overlaid on visible light images of the cluster. Click here for a version without annotations. Image credits: ESA / LFI and HFI Consortia (Planck image); MPI (ROSAT image); NASA/ESA/DSS2 (visible image). Acknowledgement: Davide De Martin (ESA/Hubble)


